Turning Claims Data Into Content People Actually Share

Let's Talk About Data
Trupanion sits on a goldmine of claims data most brands would leave in a spreadsheet. I turned it into four different content formats — real payout receipts, a poison-risk breakdown that beat our engagement average by 61% on sentiment alone, a meme chart that hit a 78% share rate, and a Spotify-Wrapped-style year in review that outperformed our carousel average by 72%. Here's how each one worked.
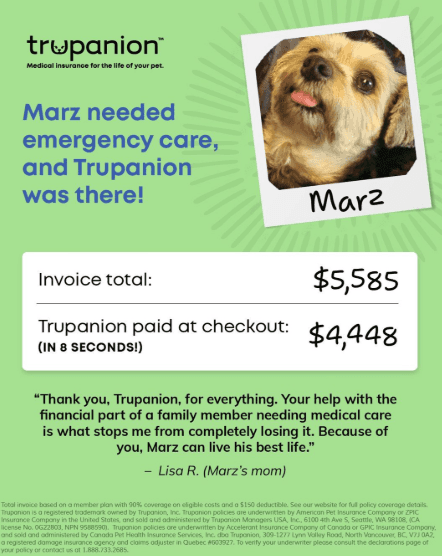
I conceived and led "Show Them the Receipts" — a monthly series surfacing real member claim totals to show, not tell, how fast and direct Trupanion payouts actually are. I wrote the brief, built the visual template, and made the call to prioritize raw transparency over polish. It worked: members started submitting their own claim stories and images, unprompted, giving us an ongoing supply of authentic creative for paid and earned channels too.
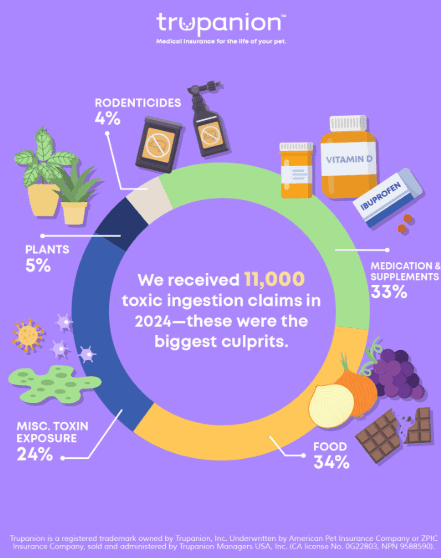
I turned 2024 claims data into a four-post series ranking the most common toxic-ingestion risks, with a snapshot-style graph and branded illustrations for quick recognition and education. It drove Engagement Rate +14%, Premium Engagement (shares + saves) +22%, and Positive Sentiment +61% versus our FY24 average — the graph post was our top performer that quarter, and the format stuck: it's still part of the recurring content calendar today.
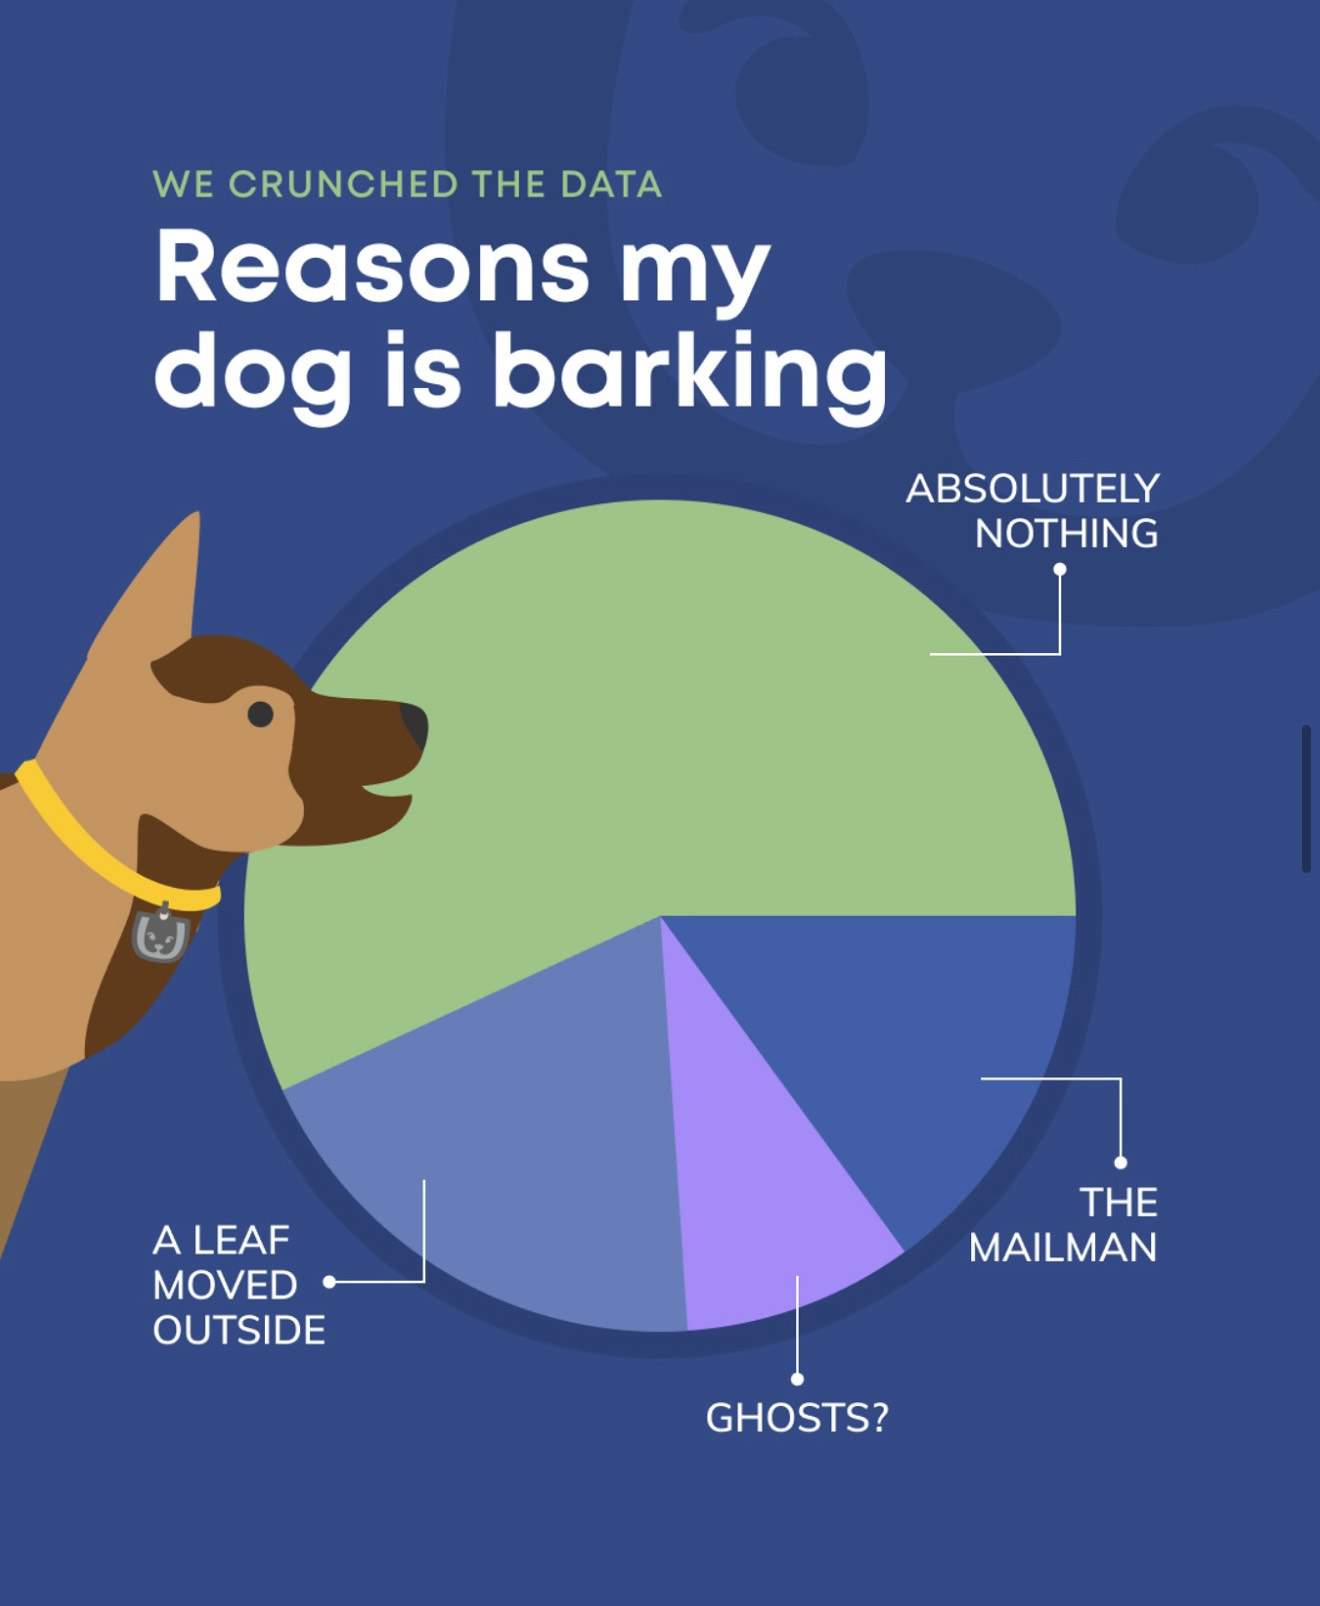
I also used our data-driven visual language for humor — a chart-style post asking the eternal question every dog owner has. Same credible format our audience trusts for health info, applied to something purely fun. It drove a 78% average share rate across Instagram, Facebook, and X — proof a trusted format can flex into something lighter without losing brand authority.
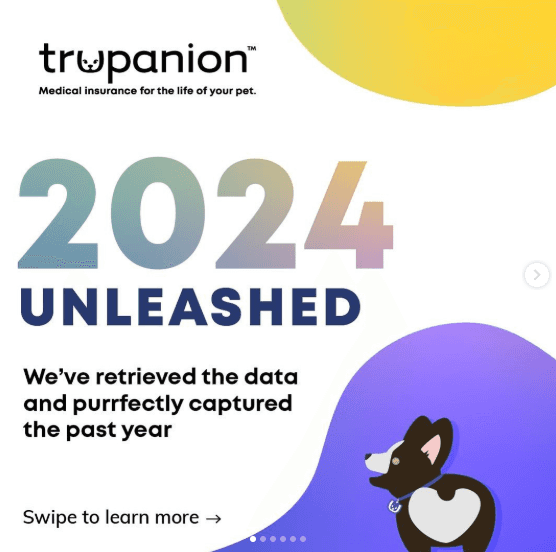
At the end of 2024, I adapted the Spotify Wrapped format into a "Trupanion Wrapped" carousel — pulling the year's biggest claims wins into a snackable, celebratory recap instead of a somber insurance one. It surpassed our FY24 carousel engagement-rate average by 72%, and reinforced Trupanion as a partner in pet care rather than just a policy.
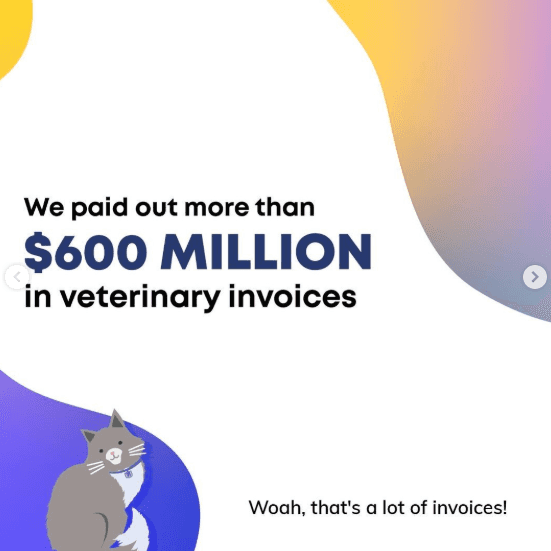
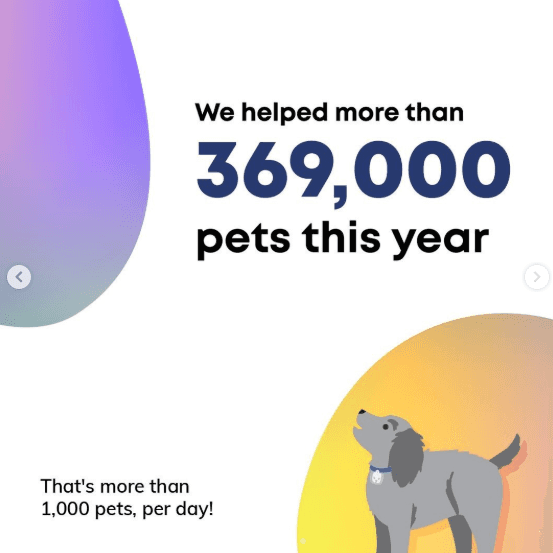
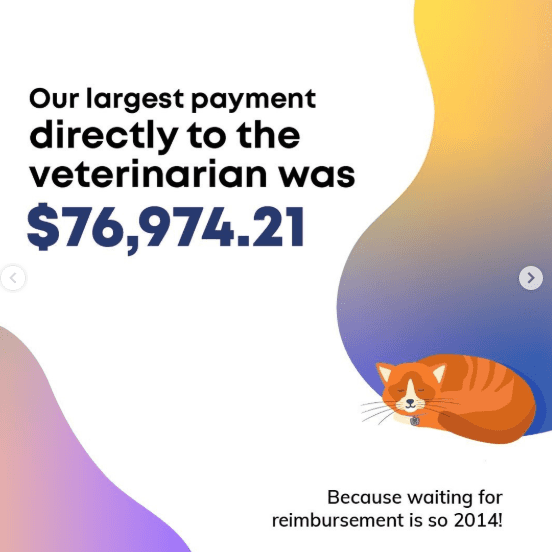
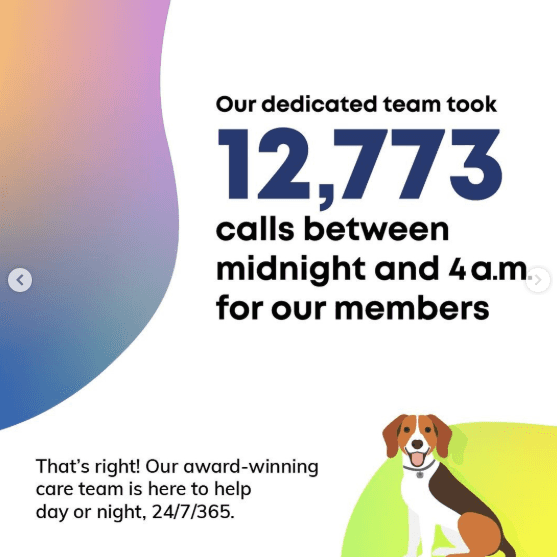
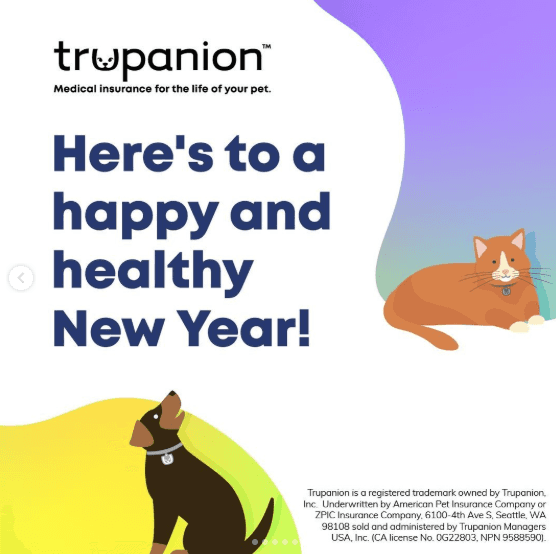
The post drove strong performance, surpassing our FY24 engagement-rate average for carousel creative by 72%. Most importantly, it reinforced Trupanion as a partner in pet care, drove audience engagement through a culturally relevant moment, and turned claims data into a confident, optimistic story our community could celebrate and share.