Making Member Data Compelling

Let's Talk About Data
Member data shouldn’t be a buried spreadsheet or a quarterly checkbox — it should be the strategic fuel for social storytelling that wins attention, trust, and retention. I had a clear point of view: translate membership signals into bold briefs, headline-first visuals, and micro-copy that nudges action and conversation.
This page is a pragmatic playbook I use to drive storytelling at scale — from shaping strategy and writing crisp creative briefs to making brave creative bets that turn stats into pet parent moments. Read on for repeatable tactics that let data stop informing decisions and start shaping the narratives that keep members coming back.
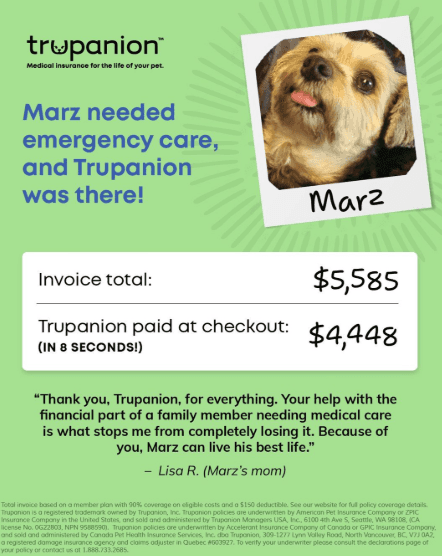
I conceived and led the "Show Them the Receipts" series to surface real member claim totals and spotlight the true cost of pet ownership, validating Trupanion’s fast, direct payouts at checkout. As the strategic lead, I translated claims data into a monthly, static social format: representative claim selections, standardized visual templates, and punchy, on-brand captions that balance credibility with emotional resonance.
My role spanned strategy to execution — writing the creative brief, making the bold editorial choices that prioritized transparency, and guiding teammates to produce templates built for scale and shareability. The format was designed to stop the scroll, build trust quickly, and convert viewers into storytellers.
Post-launch we saw a meaningful influx of member-submitted images and testimonials, and importantly those members granted permission to amplify their stories across media. The result: a repeatable social play that turns internal data into owned storytelling, strengthens proof points at checkout, and supplies high-quality creative assets for paid and earned channels.
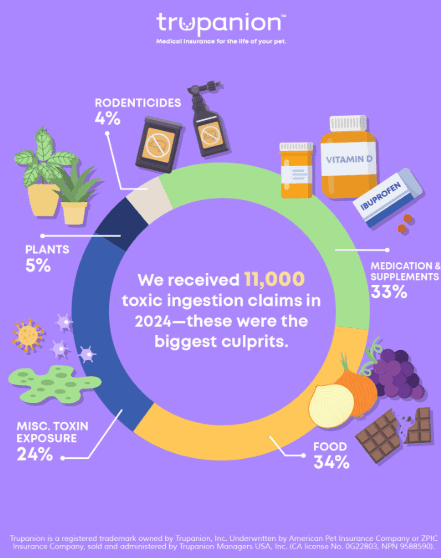
For Pet Poison Prevention Month I developed a focused four-post series to move beyond a one-off reminder and position our brand as a trusted pet-health resource. I translated 2024 claims data into clear, user-first categories and designed a snapshot-style graph with branded illustrations to make complex information accessible and instantly shareable.
The creative was deliberately data-led and action-oriented: we surfaced the most common toxic-ingestion risks, outlined recognizable signs, and provided immediate response guidance. The graph format highlighted relative prevalence at a glance, while the illustrations made each toxin easy to identify for everyday pet owners.
The campaign drove measurable impact — Engagement Rate +14%, Premium Engagement (shares + saves) +22%, and Positive Sentiment +61% versus FY24 averages — with the graph post emerging as the top performer. More than metrics, the series increased follower trust and loyalty by turning clinical claims data into practical, branded education our community will return to and share.
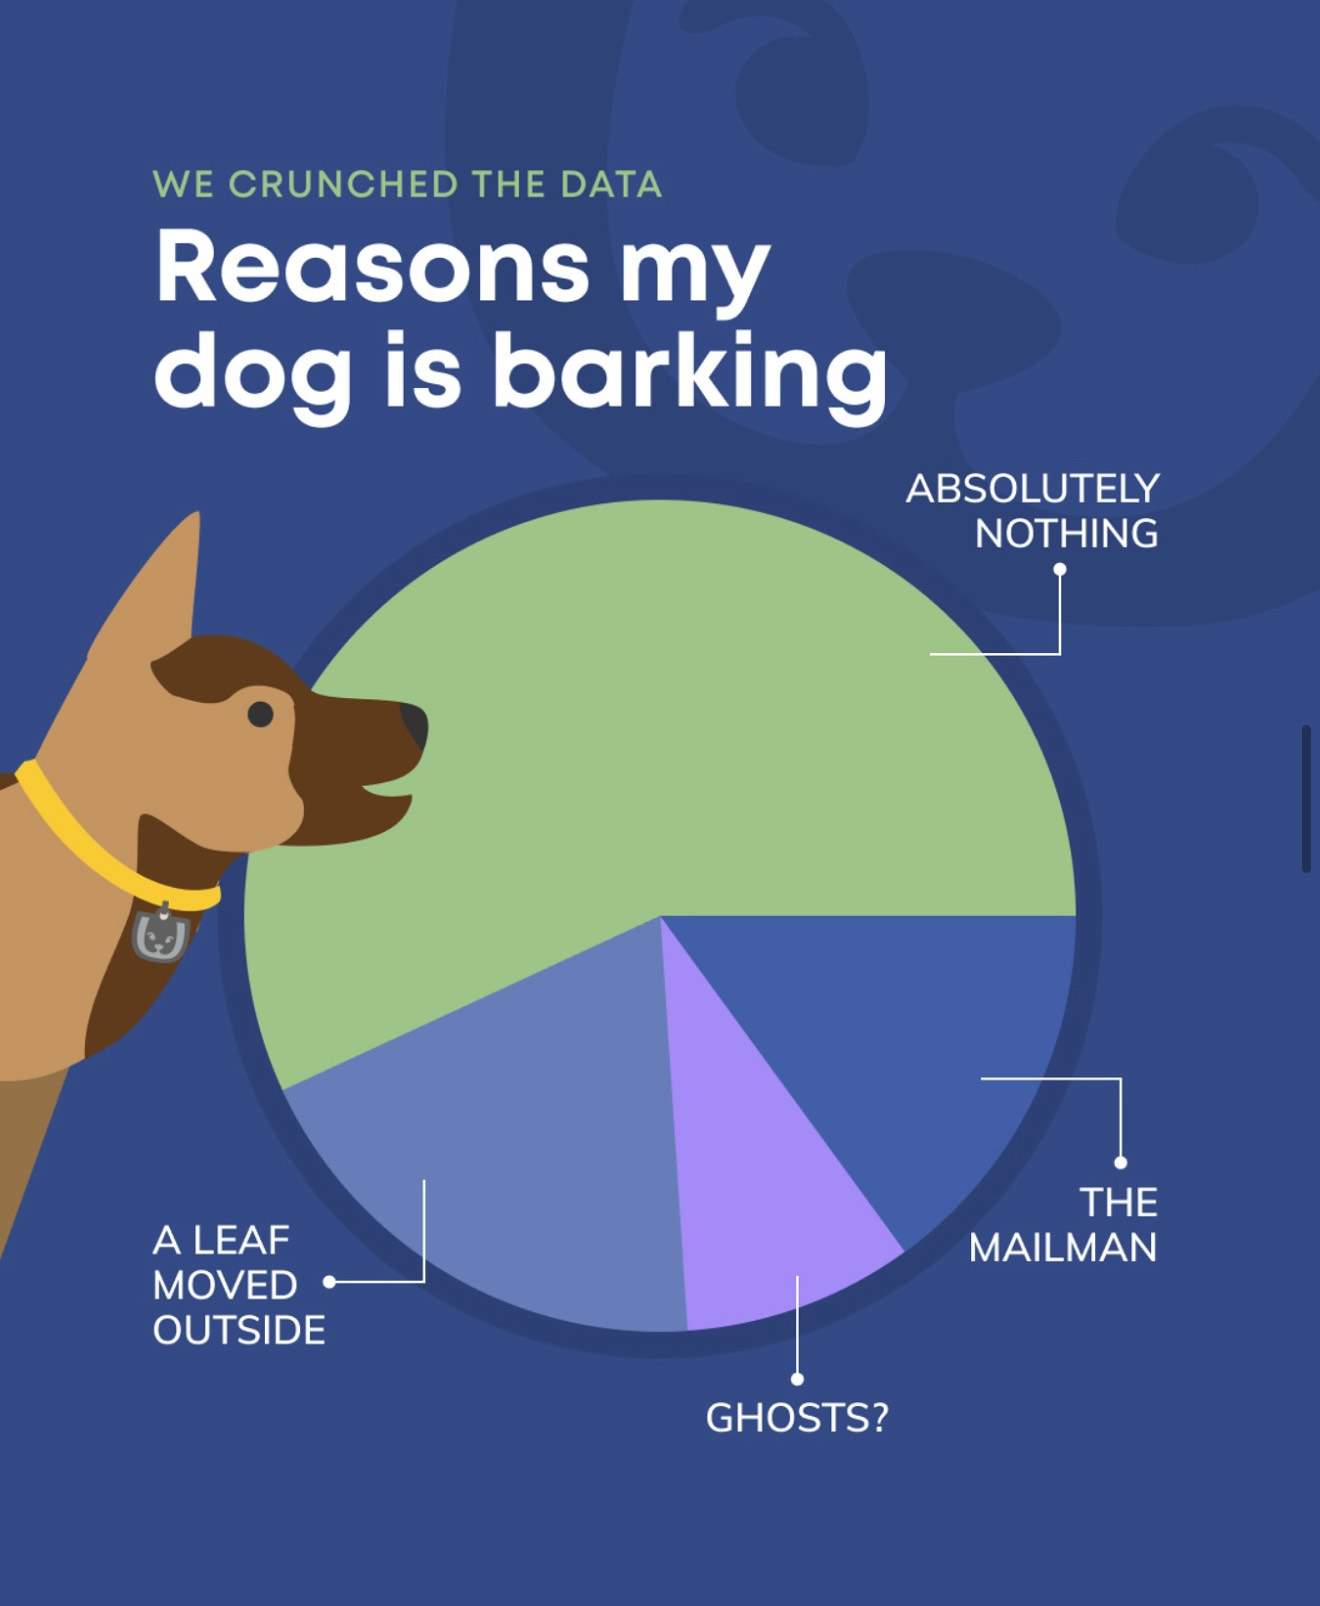
I led a playful experiment to expand Trupanion’s social voice by repurposing our trusted data-language for humor. Because our audience associates charts with serious pet-health information, I turned that expectation on its head with a graph that narrates the universal dog-owner mystery: “What is my dog barking at?” The idea used familiar visual credibility to deliver a light, meme-like story that felt both surprising and authentic to the brand.
The creative remained on-brand by leaning into everyday relatability rather than gimmickry—simple, shareable copy paired with a clean, chart-driven visual that teased recognition before landing the joke. That balance let us preserve Trupanion’s authority while showing a warmer, community-first side of the feed.
The post exceeded expectations, driving a 78% average in shares across Instagram, Facebook, and X. The result validated a broader insight: familiar formats can be subverted to create delight, strengthen community connection, and amplify reach without compromising brand integrity.
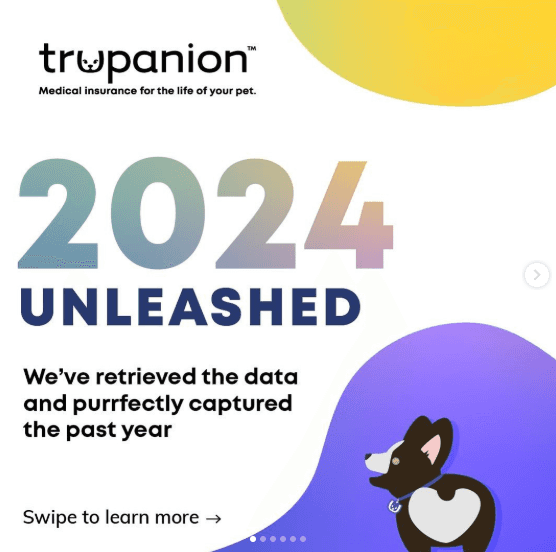
I adapted the Spotify Wrapped moment for Trupanion at the end of 2024, translating a cultural trend into a data-first brand moment that stayed true to our tone and respect for sensitive pet-health topics. Using 2024 claims data, I identified the year’s most meaningful outcomes—big wins that told a clear story of Trupanion’s real-world impact for pet families. The goal was to celebrate outcomes, not trivialize care.
The creative mirrored Wrapped’s familiar, snackable format while keeping the content informational and uplifting. I paired clean, memorable visuals with concise copy and a few light, brand-aligned quips to guide the narrative toward positive outcomes and reassurance. Every element was designed to boost shareability and make the data feel human and useful.
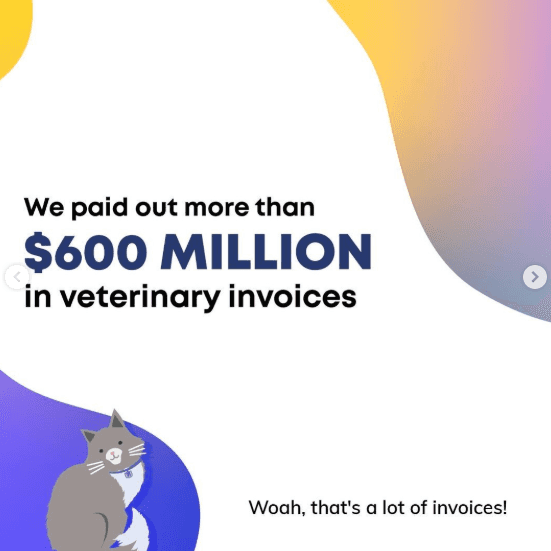
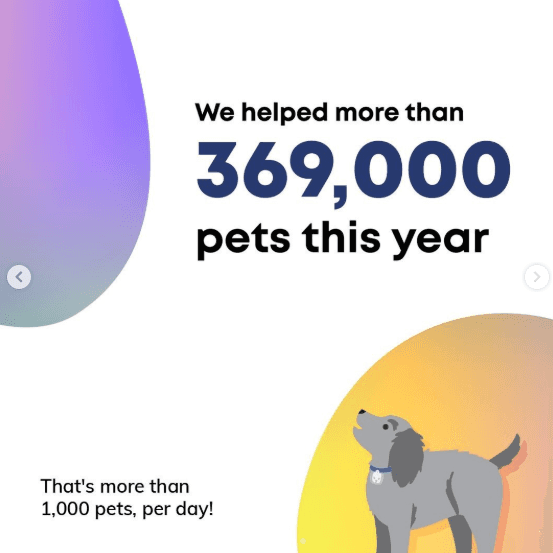
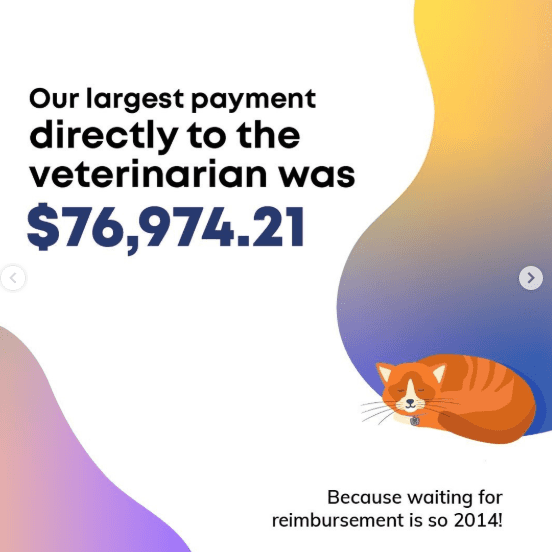
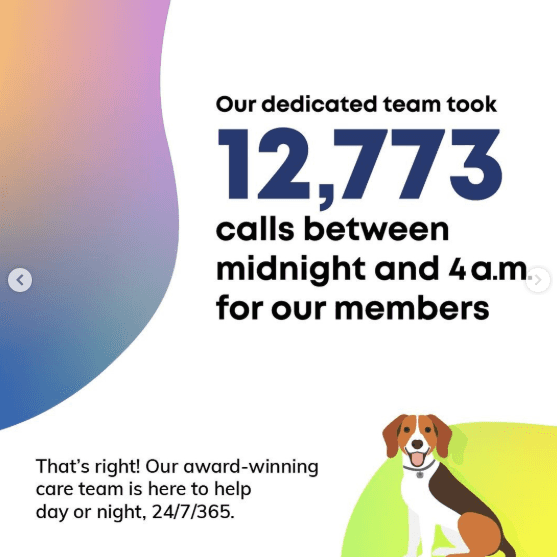
The post drove strong performance, surpassing our FY24 engagement-rate average for carousel creative by 72%. Most importantly, it reinforced Trupanion as a partner in pet care, drove audience engagement through a culturally relevant moment, and turned claims data into a confident, optimistic story our community could celebrate and share.